
Obtaining meaningful and comparable KPIs from renewable energy forecast evaluations
In order to deliver the best possible outcome over the lifecycle of a forecasting service, forecast accuracy needs to be continuously monitored and models need to be constantly updated. It can also be used to identify issues with the underlying data or with the performance of the underlying asset itself.
However, there is no simple answer to the question “How good is this forecast?”, and for the exact same algorithms, this answer can greatly vary depending on the purpose and circumstances for which the forecast has been generated. It is critical to understand the various techniques of measuring accuracy and to carefully identify from the start the ones most suitable for the demands of your business.
Selecting relevant forecast quality KPIs
The difference between forecast and actual generation is called forecast error. In power generation forecasting applications, it is typically calculated for each relevant time interval (such as 15 or 60 minutes), and subsequently aggregated. A forecast quality KPI has to be normalized, e.g. with respect to the installed capacity or the amount of energy produced, in order to be comparable across different assets.
While the normalized RMSE is widely used for evaluating power forecast, the relevant KPI may vary from application to application and therefore needs to be clearly specified.
Mean Error (Bias)
Normalized bias is the mean forecast error, normalized to the installed capacity. Since positive and negative deviations cancel out in this summation, the nBIAS gets very small for a sufficiently large number of events. If the resulting nBIAS is nevertheless high, this points to a systematic error of the forecast.
Mean Absolute Error (MAE)
The normalized mean absolute error represents the average error. It is well-suited for profitability calculations, since the costs for balance energy can be derived from the nMAE.
Root Mean Square Error (RMSE)
Due to the quadratic nature of the nRMSE, and in contrast to the nMAE, larger forecast errors are given a stronger weight than smaller ones. In the fields of meteorology and energy meteorology, nRMSE is the prevalent assessment.
Application-specific KPIs
Depending on the application, there may be specific KPIs representing the desired behavior of the forecast or the cost associated with the forecast error, such as penalties or imbalance costs.
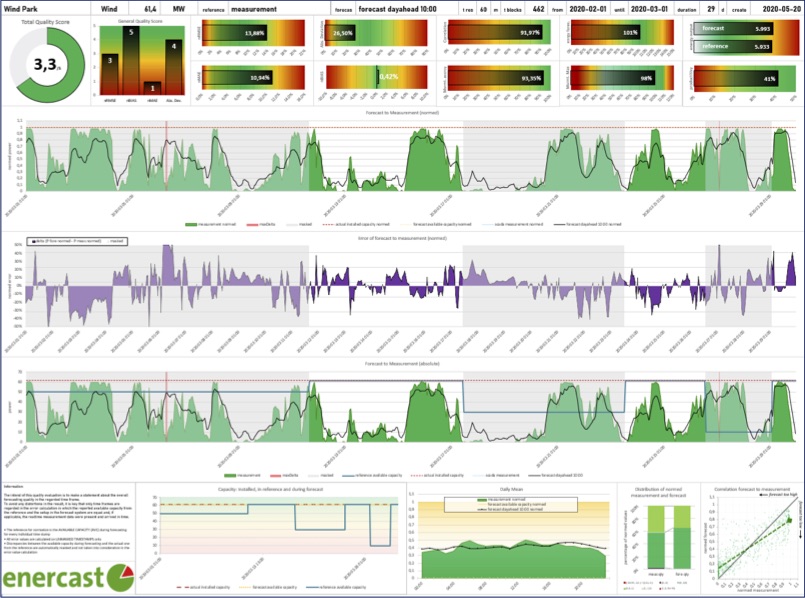
In a comprehensive quality evaluation, different quality metrics are compared and combined. Plant availability is a critical input to the evaluation, as it is not generally forecastable.
Obtaining meaningful and comparable KPIs
Forecast quality KPIs are only valid for the underlying data but they are used for decisions that affect the future. While this implies an unavoidable degree of uncertainty, meaningful and comparable KPIs can be obtained if some important factors are considered.
Evaluation period
When assessing the general performance of a forecast model, the evaluation period should be representative for all seasons, e.g. by covering a full year.
When comparing different forecast models, in any case this must be done with exactly the same actuals and the same evaluation period.
Forecast horizons and update times
As forecast error increases with increasing forecast horizon, forecast update times and lead times must match between different forecast models when they are compared.
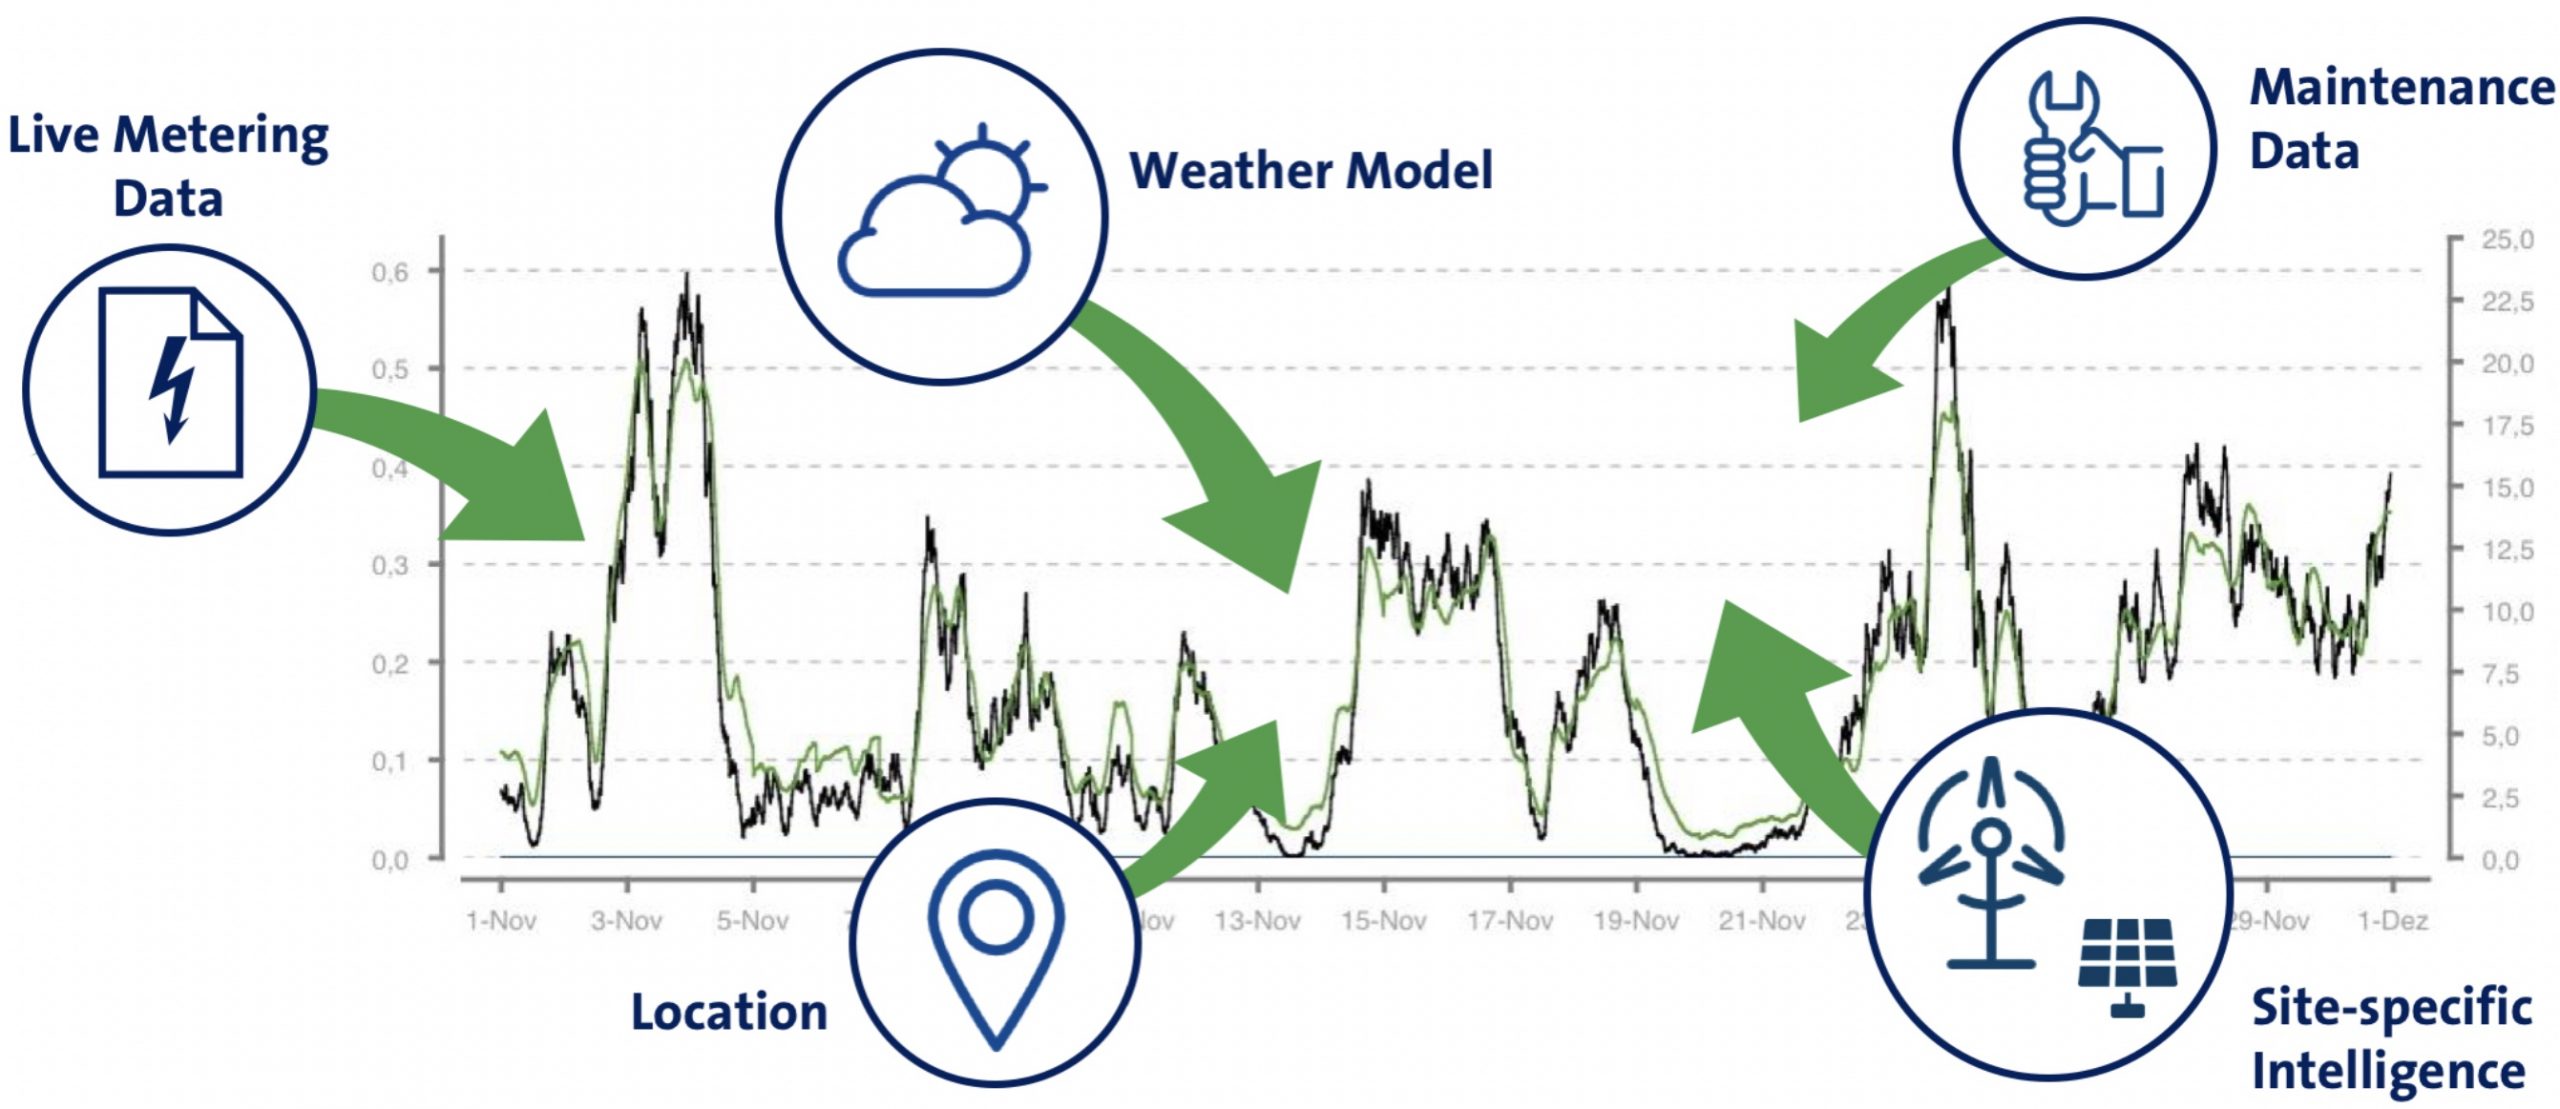
Non-forecastable influencing factors
The actual performance of a wind or solar plant is influenced by a number of non-weather but plant-specific factors. Non-forecastable influences should be removed from evaluations or need to be treated with special consideration.
These are for example temporary unavailability of parts of or the entire installed capacity or environmental limitations. As the available capacity is the basis of the forecast and is typically used to calculate normalized metrics, these changes directly affect the evaluation result this reason, the status and operational mode of the plant needs to be provided and considered in the evaluation.
Get more insights with our Whitepaper
Read our White Paper: Accurate Power Forecasts for Variable Renewable Energy Using enercast e³ Technology to learn more about how consistent evaluations enable your business to get the best possible benefit from your forecasts and which pitfalls you can avoid.
enercast GmbH
Universitätsplatz 12
34127 Kassel
Germany
T +49 (5 61) 4 73 96 64-0
F +49 (5 61) 4 73 96 64-99
E info@enercast.de