
Interactive forecast quality evaluation in the enercast portal
The quality of the wind and solar power generation forecast is a critical success factor for renewable energy businesses. To help our users tailor the quality evaluation to their needs, the enercast Portal offers a number of widgets for interactive forecast evaluation.
The quality widget calculates the most common error measures and presents them as a table. This includes, for example, the root mean square error (RMSE), a commonly used error measure in meteorology and energy meteorology, but also the mean absolute error (MAE) or the bias. Thus, the most appropriate quality metric for the application can be used.
The forecast error chart plots the error curve on the same time axis as the forecast time series. This makes it possible to quickly identify periods with particular anomalies. You can then zoom into these periods interactively to analyze the anomalies in more detail. In this way, for example, errors in the meter data can be uncovered and subsequently corrected. Finally, the daily mean chart is a way to investigate systematic forecast errors.
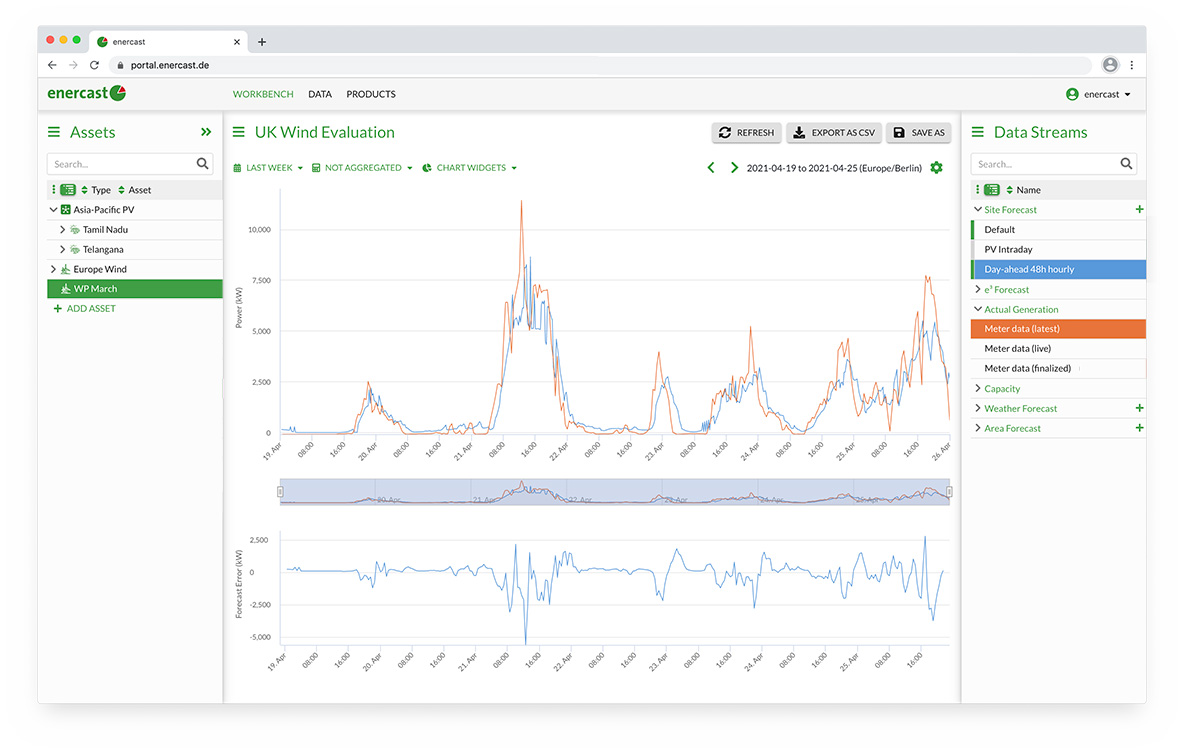
The new widgets for evaluating the forecast quality are integrated directly into the chart view of the Workbench.
For the evaluation of forecasts, the meter data stored in the enercast integration platform IPL are used, which have been imported, for example, from SCADA systems for real-time forecast enhancement. However, if available, final billing data can also be selected specifically and used for the evaluation.
The evaluation of the forecasts is based on the criteria defined in the forecast configuration, such as delivery times and evaluation window. This guarantees that from the delivered time series which are often often overlapping, exactly the section that is most relevant to the user’s business processes is taken into account. Different forecast configurations with their respective forecast horizons can thus be compared quickly.
Especially for customers in India, we have also developed the Penalty widget, which we will present in an upcomin garticle.
Get your free demo
Do you want to know more about the enercast Portal and its features? Request a personal consultation with live demo here!
Sign up for our newsletter
Did you like our blog post and want to receive regular updates on renewable energy performance forecasting? Then the best thing to do is sign up for our newsletter right now..

enercast GmbH
Universitätsplatz 12
34127 Kassel
Germany
T +49 (5 61) 4 73 96 64-0
F +49 (5 61) 4 73 96 64-99
E info@enercast.de